
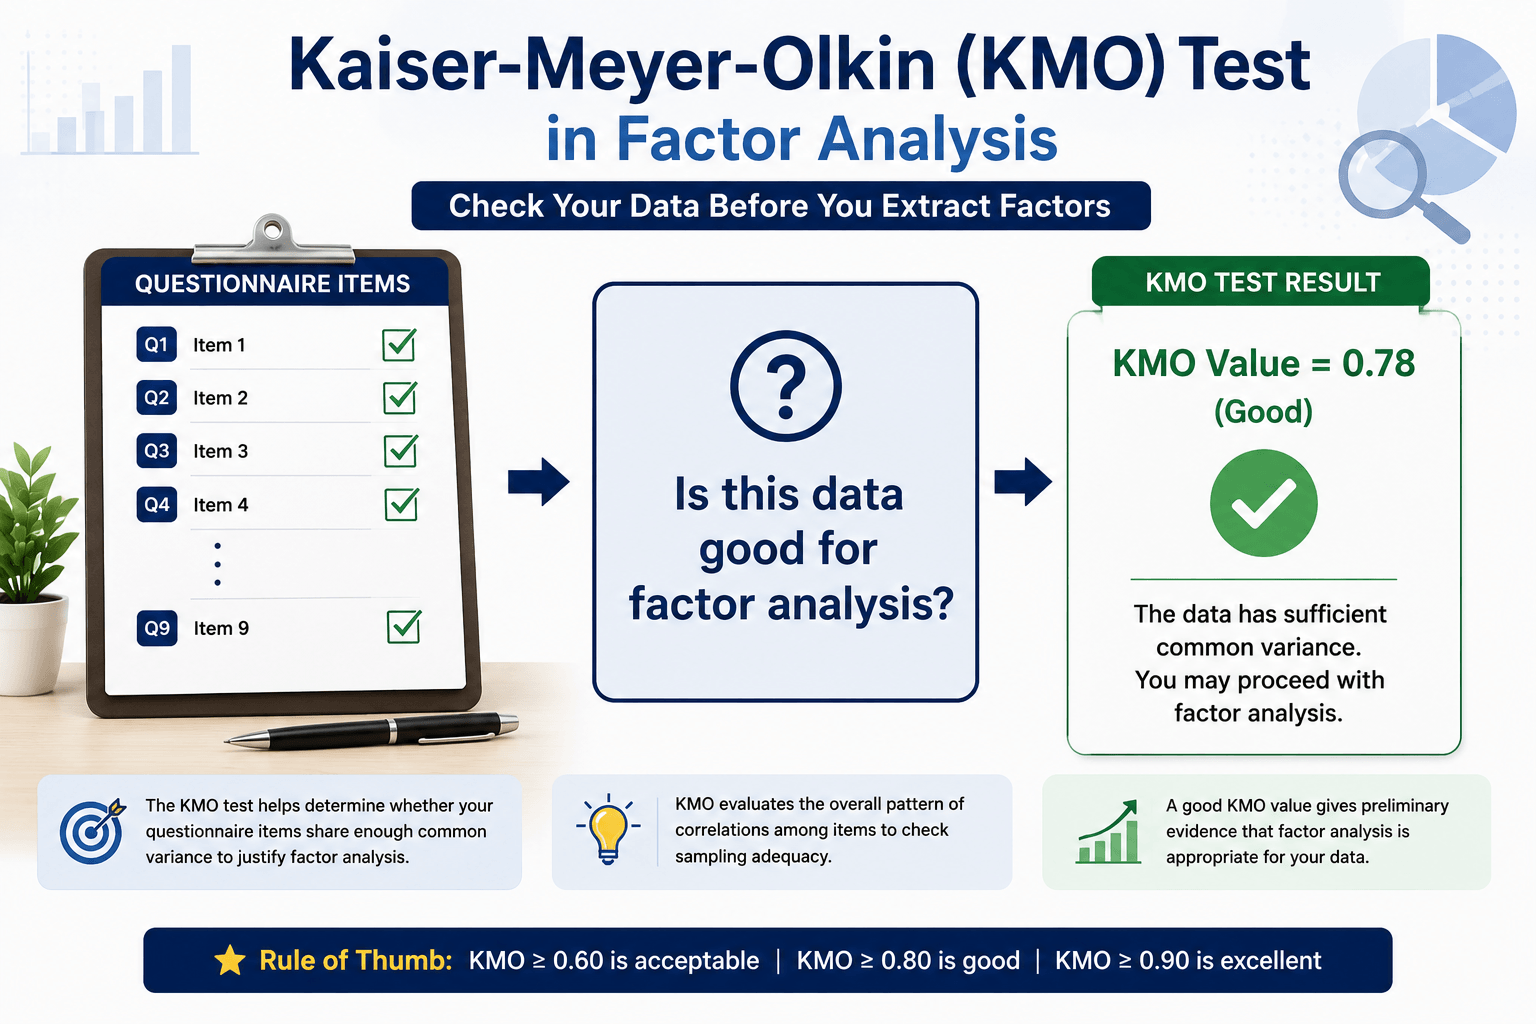
If you are preparing to conduct factor analysis for a thesis, dissertation, or research paper, one of the first questions you must answer is whether your data are suitable for exploratory factor analysis. The Kaiser-Meyer-Olkin (KMO) test helps answer this question by showing whether your questionnaire items share enough common variance to justify extracting underlying factors. In this guide, you will learn what the KMO test means, how to interpret KMO values, how to check it in SPSS, Stata, R, and Mplus, and how to report the result in academic writing.
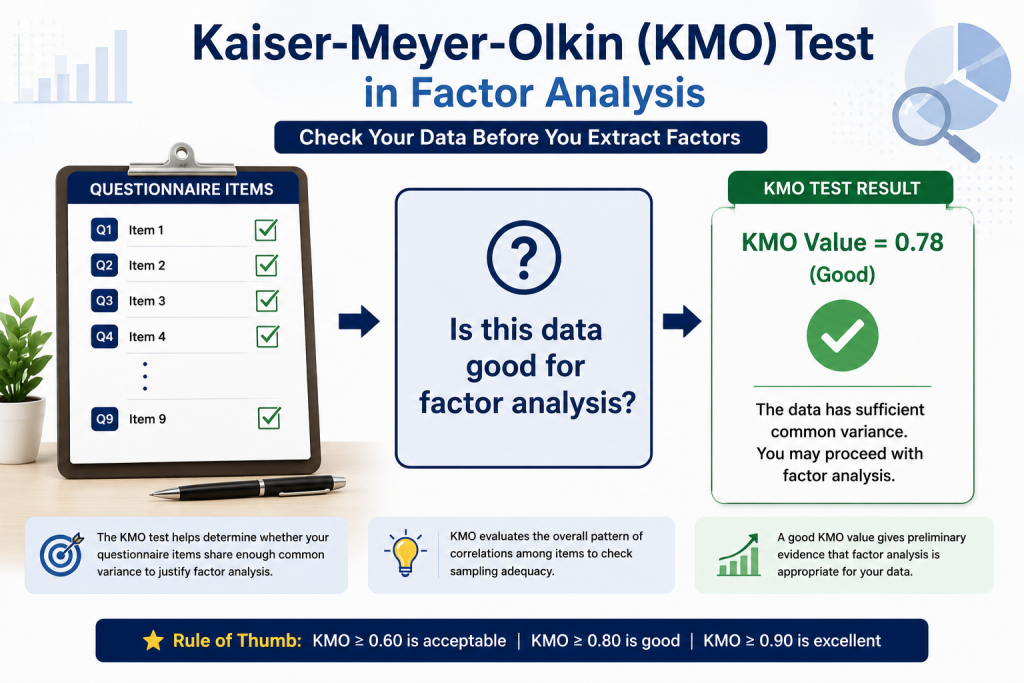
What Is the Kaiser-Meyer-Olkin (KMO) Test?
The Kaiser-Meyer-Olkin (KMO) test is a preliminary diagnostic measure used before conducting exploratory factor analysis. It helps determine whether the variables or questionnaire items are suitable for factor extraction.
Technically, KMO is a measure of sampling adequacy. It examines whether the pattern of correlations among variables is strong and compact enough to produce reliable factors.
In simple terms, KMO answers this question:
Are the items sufficiently related to each other to justify factor analysis?
For example, suppose a researcher has nine items intended to measure three dimensions of motivation. Before extracting factors, the researcher should check whether those items share enough common variance. If the KMO value is acceptable, the researcher has initial support for proceeding with factor analysis.
What Does the KMO Test Measure?
The KMO test compares:
observed correlations among variables
with
partial correlations among variables
If variables share common underlying factors, their observed correlations should be relatively strong, while their partial correlations should be relatively small.
A high KMO value means that the items have enough shared variance for factor analysis. A low KMO value means that the items may not be sufficiently related, or that some items may not belong to the same measurement domain.
KMO Test and Sampling Adequacy
Sampling adequacy does not only mean having a large sample size. In factor analysis, it also means that the correlation pattern among items is suitable for extracting factors.
A dataset may have many respondents, but if the items are poorly related, the KMO value can still be low. Similarly, a moderate sample size may produce an acceptable KMO if the items are strongly and meaningfully related.
Therefore, KMO should be understood as a measure of whether the data structure is suitable for factor analysis, not merely whether the sample size is large enough.
Why Is the KMO Test Important in Factor Analysis?
The KMO test is important because factor analysis is based on the idea that observed variables are related because of one or more underlying latent factors.
If the items do not share enough common variance, factor analysis may produce weak, unstable, or meaningless factors. In that case, the result may not represent a real construct but only random patterns in the data.
For thesis and PhD research, KMO helps justify the decision to proceed with Exploratory Factor Analysis or other factor-based procedures.
A good KMO value gives preliminary evidence that:
- the items are sufficiently related,
- the correlation pattern is suitable for factor analysis,
- the data contain common variance,
- and factor extraction is reasonable.
However, KMO should not be used alone. It should be interpreted together with Bartlett’s Test of Sphericity, the correlation matrix, communalities, factor loadings, simple structure, reliability, and theoretical meaning.
KMO Test in SPSS
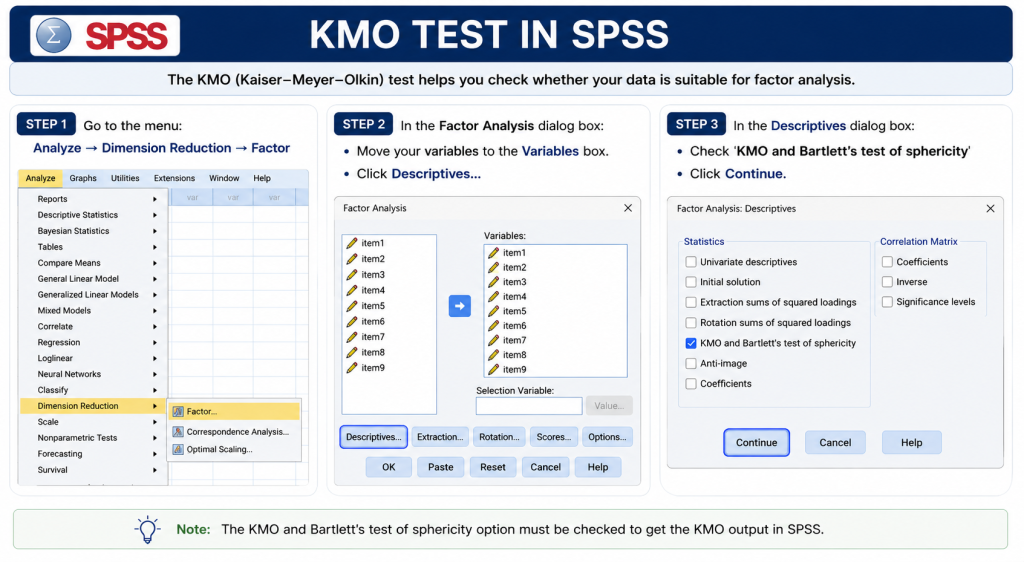
In SPSS, KMO is available through the Factor Analysis menu.
Use this path:
Analyze → Dimension Reduction → Factor → Descriptives → KMO and Bartlett’s test
After running the analysis, SPSS provides a table usually titled KMO and Bartlett’s Test. See image below for detail.
KMO Test in Stata
In Stata, the KMO test can be obtained after running factor analysis.
Example command:
factor item1 item2 item3 item4 item5 item6 item7 item8 item9
estat kmo
The estat kmo command provides the overall KMO and item-level MSA values.
KMO Test in R
In R, KMO can be calculated using the psych package.
Example command:
# Install the package if you haven't already
install.packages("psych")
# Load the package
library(psych)
# Use your data (e.g., a data frame or correlation matrix)
# KMO() can take raw data or a correlation matrix as input
KMO(your_data)
The output usually gives the overall MSA and the MSA value for each variable.
KMO Test in Mplus
Mplus is very strong for Exploratory Factor Analysis, however, KMO is not usually reported as a standard part of Mplus EFA output.
If the main factor analysis is conducted in Mplus, we can compute KMO first in SPSS, Stata, or R. After confirming that the data are suitable for factor analysis, we may proceed with EFA, CFA, or SEM in Mplus.
How to Interpret KMO Values
| KMO Value | Interpretation | Decision |
|---|---|---|
| 0.90 and above | Excellent | Very strong support for factor analysis |
| 0.80 to 0.89 | Very good | Strong support for factor analysis |
| 0.70 to 0.79 | Good | Acceptable and suitable for factor analysis |
| 0.60 to 0.69 | Mediocre but acceptable | Factor analysis may proceed with caution |
| 0.50 to 0.59 | Poor | Review items carefully before proceeding |
| Below 0.50 | Unacceptable | Factor analysis is usually not recommended |
| Related Information : How to Conduct Exploratory Factor Analysis: 11 Steps Roadmap for Thesis and PhD Research |
KMO values range from 0 to 1. A higher value indicates that the data are more suitable for factor analysis.
In general, a KMO value above 0.60 is considered acceptable for factor analysis. A value above 0.80 is usually considered strong. A value below 0.50 suggests that factor analysis may not be appropriate.
KMO does not automatically guarantee a good factor model. It only suggests that the data are suitable for factor analysis.
Overall KMO vs Individual KMO
There are two important forms of KMO output: overall KMO and individual KMO, also called MSA or Measure of Sampling Adequacy.
| Type | Meaning | Use |
|---|---|---|
| Overall KMO | Shows the suitability of the full set of variables | Used to decide whether factor analysis can proceed |
| Individual KMO / MSA | Shows the suitability of each item | Used to identify weak or problematic items |
The overall KMO tells whether the full dataset is appropriate for factor analysis.
The individual KMO tells whether each item is suitable for inclusion in the factor analysis.
For example, the overall KMO may be 0.78, which is acceptable. However, one item may have an individual MSA of 0.42. In that case, the researcher should review that item because it may be weakening the factor structure.
Note: Both overall KMO and individual KMO/MSA use the same 0 to 1 scale, and the same general interpretation ranges are often applied.
What to Do If the KMO Value Is Low
A low KMO does not always mean the study is invalid. It means the researcher must carefully review the items, the correlation matrix, and the theoretical logic of the measurement scale.
We should avoid deleting items solely because of a low individual KMO/MSA value. Low MSA should be interpreted as a preliminary warning, not as an automatic deletion rule. Item deletion is more defensible when the low MSA is supported by EFA evidence such as poor factor loading, high cross-loading, low communality, or weak theoretical relevance.
Conclusion
The Kaiser-Meyer-Olkin test is an important preliminary measure in factor analysis. It helps determine whether the variables or questionnaire items share enough common variance to justify factor extraction.
A KMO value above 0.60 is acceptable, while a value above 0.80 is considered strong. However, KMO should not be interpreted alone. It should be considered together with Bartlett’s Test of Sphericity, the correlation matrix, factor loadings, communalities, reliability, and theoretical reasoning.