If you are writing a Master’s thesis, PhD dissertation, or journal article using survey data, you may have reached the stage where you need to check whether your questionnaire items actually measure the constructs you intended to measure. This is where Exploratory Factor Analysis (EFA) becomes important. and this page discuss about how to conduct exploratory factor analysis. EFA helps you identify the hidden factor structure behind your items, decide which items belong together, detect weak or cross-loading items, and refine your measurement scale before moving to reliability testing, Confirmatory Factor Analysis, or Structural Equation Modeling.
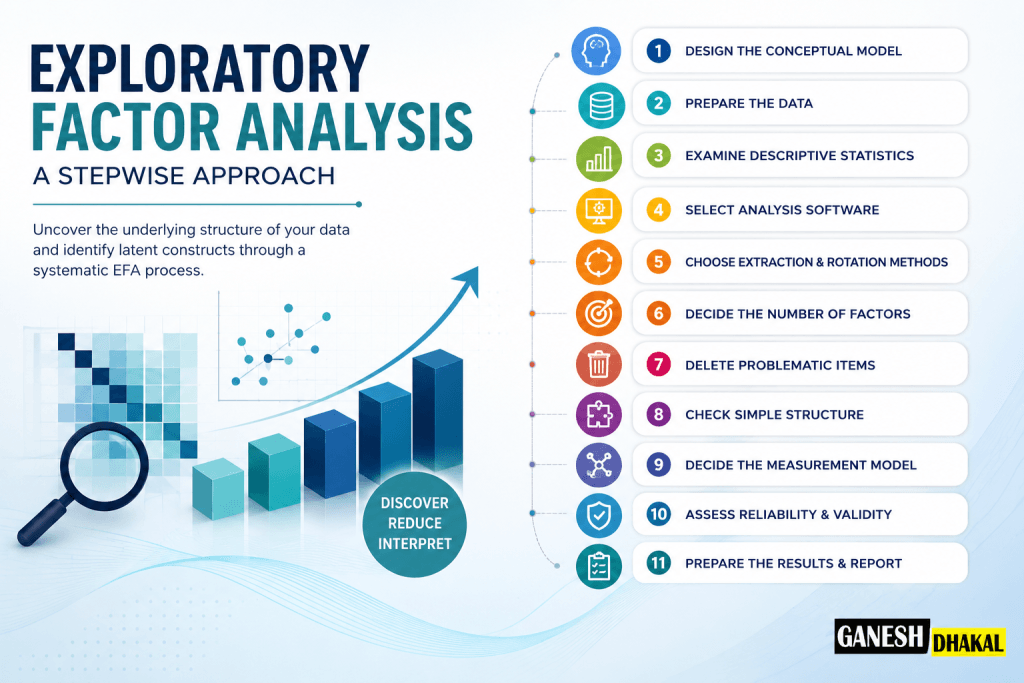
What Is Exploratory Factor Analysis?
Exploratory Factor Analysis, commonly known as EFA, is a statistical technique used to identify the underlying latent factors behind a set of observed variables or questionnaire items.
A latent factor is not directly observed. It is inferred from several related indicators. For example, concepts such as job satisfaction, public service motivation, organizational commitment, academic motivation, research self-efficacy, or leadership perception cannot be directly observed. These constructs are usually measured through several questionnaire items.
For example, a researcher may ask respondents to answer items related to salary, benefits, job security, promotion, and financial reward. If these items are strongly related, EFA may show that they belong to one common factor, such as extrinsic motivation.
At graduate level, EFA is not only used to reduce the number of items. Its deeper purpose is to examine whether the theoretically purposed measurement structure is statistically defensible.
EFA and CFA: What Is the Difference?
Many graduate students confuse Exploratory Factor Analysis with Confirmatory Factor Analysis. Both are used in measurement validation, but they serve different purposes.
| Exploratory Factor Analysis | Confirmatory Factor Analysis |
| – EFA is used when the researcher wants to explore the possible structure among items. It is useful when the number of factors is uncertain or when a scale is being tested in a new context. | – CFA is used when the researcher already has a proposed measurement model and wants to test whether that model fits the data. |
|
– EFA asks: “What factor structure exists in the data?” |
– CFA asks: “Does my proposed factor structure fit the data?” |
For strong thesis and PhD research, EFA is often used first to refine the measurement structure. CFA may then be used to confirm the refined structure.
When Should You Use Exploratory Factor Analysis?
EFA is appropriate when the researcher does not want to impose a fixed measurement structure at the beginning of the analysis. It is especially useful when the dimensionality of a construct is uncertain.
You may use EFA when you are:
- developing a new research instrument,
- adapting a scale from previous studies,
- translating a questionnaire into another language,
- using a scale in a new cultural context,
- refining items before CFA or SEM, or
- checking whether the items measure one factor or several factors.
Steps Involved in Exploratory Factor Analysis
The major steps involved in conducting Exploratory Factor Analysis are categorized into total 11 steps. Each steps are explained below:
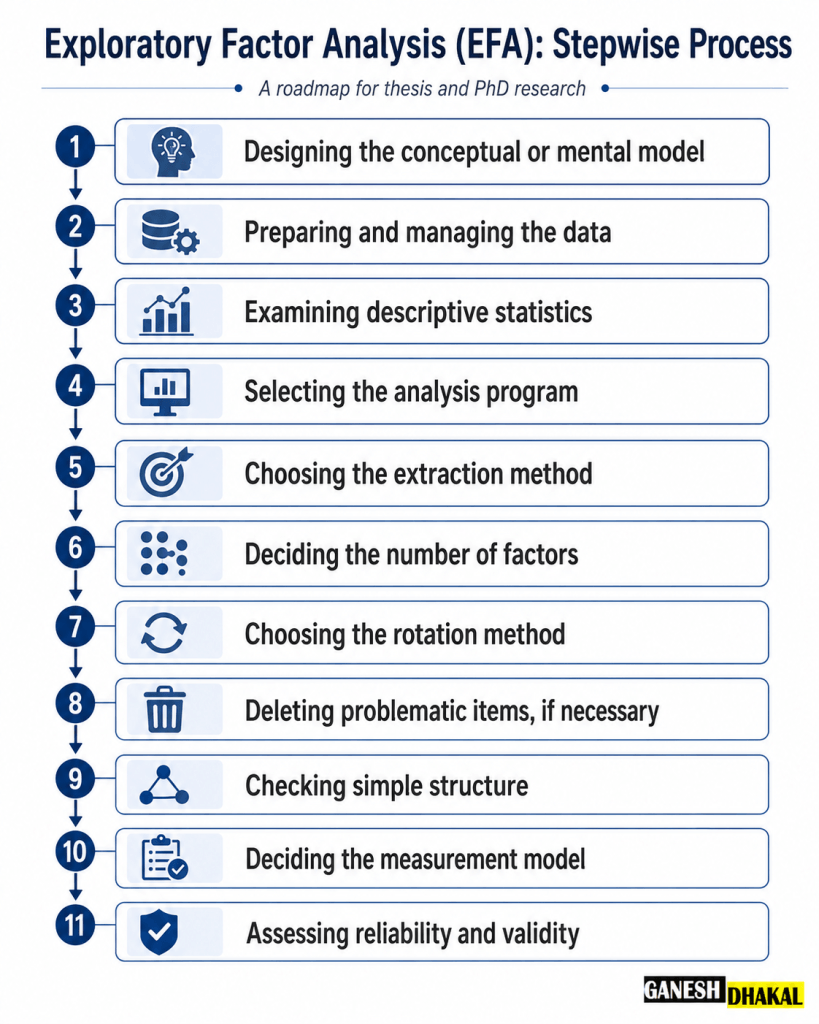
Step 1. Designing the Conceptual or Mental Model
Before running EFA, the researcher must first clarify the conceptual foundation of the study. Although EFA is exploratory, it should not be theory-free.
A researcher should not simply enter all questionnaire items into software and accept whatever output appears. The first task is to understand the construct being measured. This requires reviewing previous literature, identifying how the construct has been conceptualized, and examining how earlier studies measured it.
For example, if the researcher is studying public service motivation, previous literature may suggest dimensions such as attraction to public service, commitment to public values, compassion, and self-sacrifice or country-specific factor. If the researcher is studying service quality, earlier studies may suggest reliability, responsiveness, assurance, empathy, and tangibility.
At this stage, the researcher should ask:
- What is the main construct being measured?
- Is the construct expected to be unidimensional or multidimensional?
- Are the items original, adapted, or translated?
- Do the items belong to the same theoretical domain?
- Is the construct sensitive to culture, institution, occupation, or country context?
- Are some items conceptually similar but empirically different?
This step matters because EFA results must be interpreted using theory. A factor may appear statistically, but if it does not make conceptual sense, it should not be accepted just because EFA showed such factor solution.
Step 2. Preparing and Managing the Data
Data preparation is one of the most important stages of EFA. Poor factor solutions often come not from the method itself but from poorly prepared data.
Before conducting EFA, the researcher should check followings:
- missing values,
- invalid responses,
- outliers,
- straight-line responses,
- reverse-coded items,
- coding consistency.
For Likert-scale data, all items must be coded in the same conceptual direction. If higher values represent a higher level of the construct, then negatively worded items must be reverse-coded before analysis.
For example, if the item “I do not feel motivated at work” is included in a motivation scale, it must be reverse-coded before being analyzed together with positively worded items. If reverse coding is forgotten, the item may form a separate factor only because of wording direction, not because it represents a real construct.
Moreover, online survey data may include respondents who select the same response for every item, complete the survey too quickly, or give inconsistent answers. These cases can distort the correlation matrix and affect the factor structure.
For thesis and dissertation writing, the data-cleaning process should be documented clearly. The researcher should report how missing values were handled, how many cases were removed, and what criteria were used for screening.
Step 3. Examining Descriptive Statistics
After cleaning the data, the researcher should examine descriptive statistics for each item. This includes:
- mean
- standard deviation,
- minimum and maximum (to check if there are number beyond 5 if we are using 5 point Likert-scale)
- skewness and kurtosis,
- Correlation Matrix
This step helps identify items that may not work well. If almost all respondents choose the same response option for an item, that item has limited variation. An item with very little variation (standard deviation close to zero) may not help distinguish between respondents.
The researcher should also examine the correlation matrix. EFA is based on the idea that observed variables are correlated because they share common underlying factors. If the items are not sufficiently correlated, EFA may not be appropriate.
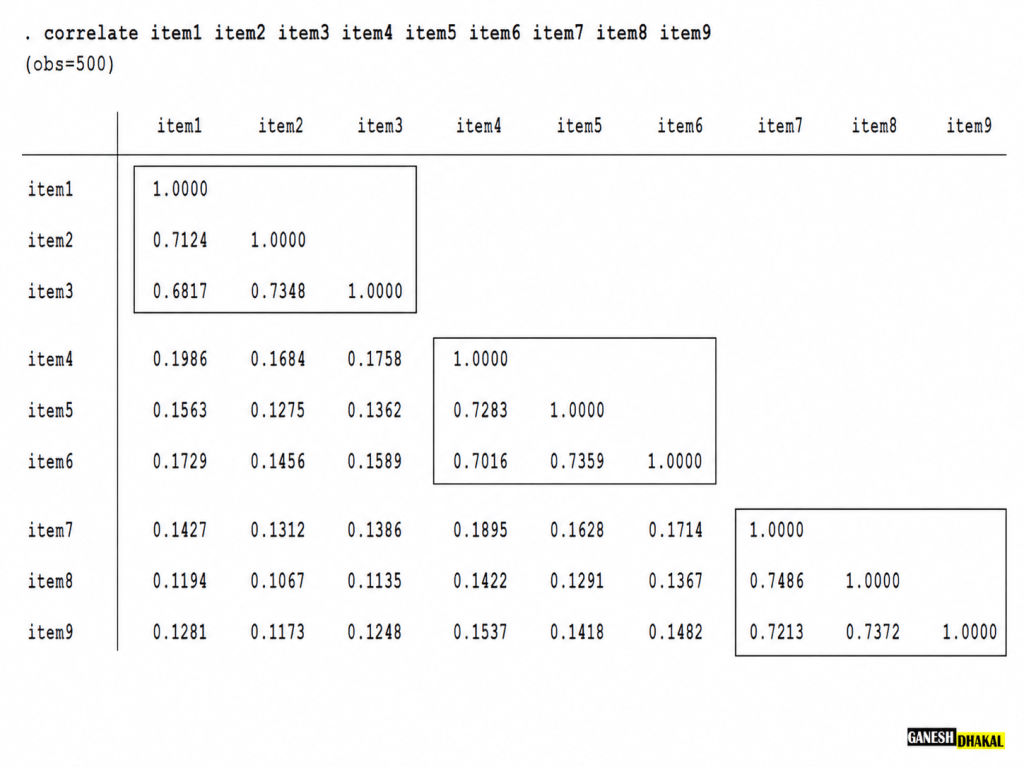
If you see the above figure, item1, item2, and item3 are highly correlated among each other and poorly correlated with other factors. In similar way Item4, item5, and item6 and item7, item8, and item8 are grouped. If our conceptual model has similar structure then this is an ideal scenario. However, it is rare to observe such ideal situation in real research work.
Before moving to EFA, two common preliminary tests are:
- Kaiser-Meyer-Olkin measure: It evaluates sampling adequacy. A KMO value above 0.60 is often considered acceptable, while values above 0.80 are generally considered strong.
- Bartlett’s Test of Sphericity. it examines whether the correlation matrix is significantly different from an identity matrix. A significant result suggests that the variables/items are sufficiently related for factor analysis.
However, these tests should not be interpreted to strongly. A significant Bartlett’s test does not guarantee a strong factor solution, and a high KMO value does not replace theoretical judgment.
For thesis writing, it is useful to report these results before presenting the factor extraction results.
Step 4. Selecting the Analysis Program
The choice of software should depend on:
- the type of data,
- the complexity of the model,
- the researcher’s statistical training,
- and the expected reporting standard.
| Basis | Mplus | R | STATA | SPSS |
| Ease of Use | Moderate | Difficult for beginners | Modarate | Easy |
| Interface | Syntax-based | Code-based | Command-based | Menu-based |
| Common extraction methods | ML, WLSMV, ULS, GLS-type estimators | MinRes, Principal Axis, ML, WLS, GLS | Principal factors, ML, PCF | Principal Axis, ML, PCA, GLS, ULS |
| Ordinal Likert data extraction | Strong with WLSMV/categorical indicators | Strong with polychoric options | Possible but less direct | Limited |
| Polychoric correlation | Supported | Supported | Possible | Limited |
| Output flexibility | High | Very high | Moderate | Low to Moderate |
| Visualization | Limited | Strong | Moderate | Limited |
| Cost | Paid | Free | Paid | Paid |
For many Master’s students, SPSS may be easier because they provide a user-friendly interface. For PhD-level research, R, Stata, or Mplus may be more appropriate because they provide greater flexibility and more advanced options.
In my personal experience, Mplus is the Gold-Standard for factor analysis.
Step 5. Choosing the Extraction Method
The extraction method determines how factors are estimated from the observed variables. This is a major methodological decision in EFA.
Common extraction methods include Principal Axis Factoring, Maximum Likelihood, Minimum Residual, Weighted Least Squares, and Unweighted Least Squares.
| Note: A common mistake is confusing Principal Component Analysis with Exploratory Factor Analysis. PCA is mainly a data reduction technique. It transforms observed variables into a smaller number of components. EFA, however, assumes that observed variables are influenced by underlying latent factors. |
Principal Axis Factoring (PAF)
Principal Axis Factoring is a common EFA extraction method that focuses on the shared variance among items rather than total variance. It is useful when the researcher wants to identify underlying latent factors and the data may not perfectly meet normality assumptions. For thesis research, PAF is often preferred over PCA when the purpose is scale development or construct measurement.
Maximum Likelihood (ML)
Maximum Likelihood estimates factors by finding the solution that is most likely to have produced the observed correlation matrix, assuming the data approximately follow a multivariate normal distribution. Its advantage is that it can provide model-fit information and allows statistical testing of factor solutions. ML is useful for more advanced EFA, but it requires stronger distributional assumptions than PAF.
Unweighted Least Squares (ULS)
Unweighted Least Squares extracts factors by minimizing the squared differences between the observed correlation matrix and the reproduced correlation matrix. It does not apply special weights to the residuals, which makes it relatively simple and less demanding than some model-based methods. ULS is useful when the researcher wants a least-squares-based factor solution with fewer assumptions.
Principal Factoring
Principal Factoring, sometimes called the principal factor method, estimates factors from the common variance shared among variables. It is different from Principal Component Analysis because it does not focus on total variance. In practice, it is close to the logic of common factor analysis and is suitable when the aim is to uncover latent constructs behind questionnaire items. It does not require strict multivariate normality.
WLSMV / DWLS
WLSMV and DWLS are estimation approaches often used when items are ordinal or categorical, such as four-point or five-point Likert-scale items. Instead of treating responses as fully continuous, they work better with ordinal-data logic, often using polychoric correlations. These methods are especially useful in advanced EFA, CFA, and SEM when the researcher wants to treat Likert-scale indicators as categorical.
Step 6. Deciding the Number of Factors
Several criteria may be used to decide the number of factors, including eigenvalues greater than one, scree plot, parallel analysis, model fit indices where available, percentage of variance explained, factor interpretability, and theoretical consistency.
Eigenvalues greater than one: The eigenvalue-greater-than-one rule is popular, but it should not be used alone. It can overestimate or underestimate the number of factors. Decision Rule: Retain factors with eigenvalues greater than 1.
Scree plot: It is useful because it shows where the eigenvalues begin to level off. The point where the curve starts to flatten is often called the elbow. Factors before this elbow are usually considered more meaningful and retained. Decision Rule: Retain the factors before the elbow point where the curve begins to flatten.
Parallel analysis is often stronger because it compares the eigenvalues from the actual data with eigenvalues generated from random data. Decision Rule: Retain only those factors whose actual eigenvalues are greater than the corresponding random-data eigenvalues.
However, statistical criteria should be combined with theory. A factor solution must make conceptual sense. If a four-factor solution is statistically suggested but one factor contains unrelated items, the researcher should reconsider the solution.
A strong approach is to compare alternative factor solutions and explain why the final solution was selected.
|
For example: The three-factor and four-factor solutions were examined. Although the four-factor solution produced an additional factor, that factor contained only two weakly related items and lacked theoretical clarity. The three-factor solution was retained because it demonstrated clearer simple structure and stronger conceptual interpretability. |
Step 7. Choosing the Rotation Method
Rotation helps make the factor structure clearer and easier to interpret. Without rotation, factor loadings may be spread across several factors, making interpretation difficult.
There are two broad types of rotation: orthogonal rotation and oblique rotation.
- Orthogonal rotation assumes that factors are not correlated. Varimax is the most common orthogonal rotation method.
- Oblique rotation allows factors to be correlated. Promax and Oblimin are common oblique rotation methods.
In social science research, oblique rotation is often more realistic because human attitudes, motivations, values, perceptions, and behaviors are usually related. For example, job satisfaction, organizational commitment, public service motivation, and work engagement are unlikely to be completely independent.
A weak explanation would be: Promax rotation was used.
A stronger explanation would be: Because the underlying constructs were theoretically expected to be correlated, an oblique rotation method was used.
This shows that the rotation method was selected based on theory, not software convenience.
Step 8. Deleting Problematic Items, If Necessary
After extraction and rotation, the researcher examines factor loadings. Factor loadings show the strength of the relationship between an item and a factor.
Items may be considered problematic if:
- they have low loadings,
- strong cross-loadings,
- unexpected factor placement with weak conceptual meaning.
A loading of 0.40 is often used as a practical threshold, but this is not an absolute rule. In exploratory studies, 0.30 may sometimes be accepted. In stronger measurement studies, 0.50 or higher may be preferred. Items with poor factor loading can be deleted.
Cross-loading is another important issue. A cross-loading occurs when an item loads meaningfully on more than one factor. This creates interpretation problems because the item does not clearly represent one construct. Items with strong cross-loading should be examined carefully before deletion. If the gap between two loadings is greater than 0.15 (some authors mention 0.2), then that item can be retained and assigned to the factor with higher factor loadings.
If a item loaded in unintended factor but lacks conceptual meaning can be dropped from the model.
However, item deletion should not be purely statistical. A researcher should not delete items only to make the output look clean. Every deletion should be justified using both statistical evidence and theoretical reasoning.
Step 9. Checking Simple Structure
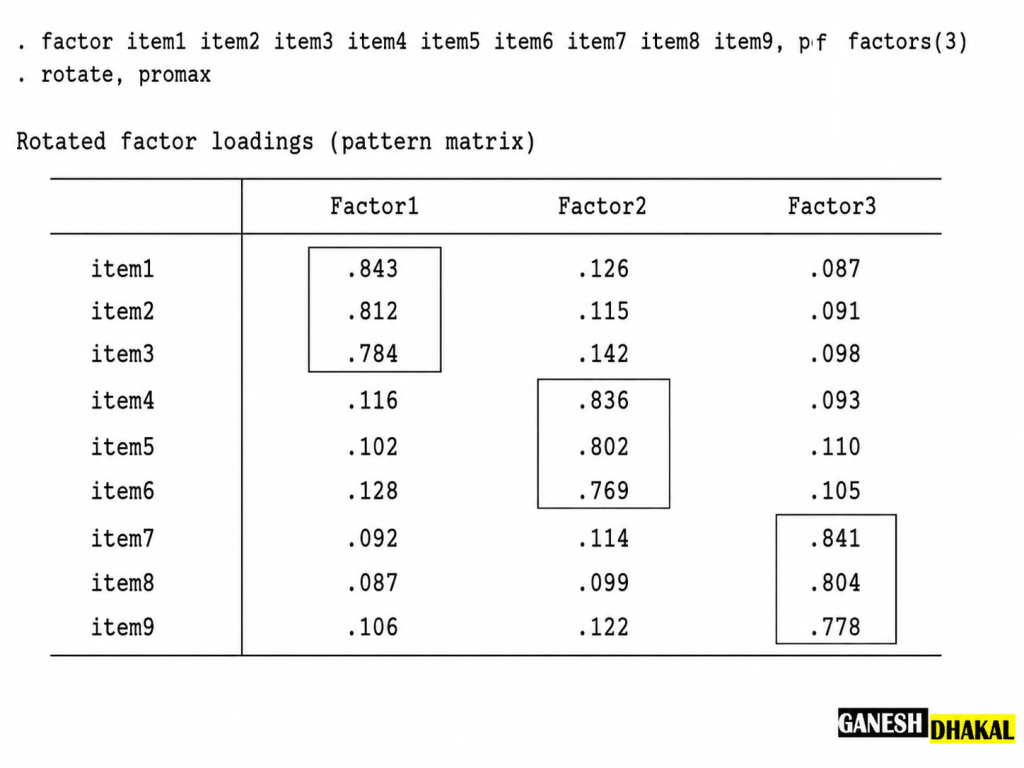
A good EFA result should demonstrate simple structure. Simple structure means that each item loads strongly on one factor and weakly on other factors.
A clean simple structure usually has strong primary loadings, low cross-loadings, theoretically related items within each factor, enough items per factor, and meaningful factor labels.
For example, if four items about compassion load strongly on one factor and weakly on others, the researcher may label that factor “Compassion.” But if the same factor contains items about compassion, salary, promotion, and political trust, the factor lacks conceptual clarity.
Simple structure is not only a statistical issue. It is also an interpretive issue. A factor should tell a coherent theoretical story. An idea scenario of simple structure is presented in the figure below:
Step 10. Deciding the Measurement Model
After checking factor loadings and simple structure, the researcher must decide the final measurement model. This means determining which items belong to which factor and what each factor should be called.
The factor names should be based on the content of the items, not only on the original scale labels. If the items behave differently from the original theory, the researcher should explain why.
This is especially important in cross-cultural and institutional research. A scale developed in one country may not produce the same dimensionality in another country. Translation, administrative culture, education level, occupational context, and respondent interpretation can affect the factor structure.
After EFA, researchers often proceed to Confirmatory Factor Analysis. EFA explores the possible structure, while CFA tests whether the proposed structure fits the data.
Step 11. Assessing Reliability and Validity
EFA helps identify the factor structure, but the researcher must still assess reliability and validity.
Reliability refers to the consistency of the scale. Common reliability measures include Cronbach’s alpha, composite reliability, and omega. Cronbach’s alpha is widely used, but it should not be treated as the only evidence of measurement quality.
Validity refers to whether the scale measures what it is intended to measure. Important forms of validity include convergent validity, and discriminant validity. Convergent validity means that items measuring the same construct are strongly related. Discriminant validity means that different constructs are sufficiently distinct from each other (lower inter-factor correlation).
Common Mistakes in Exploratory Factor Analysis
Many researchers make avoidable mistakes when conducting EFA.
- One common mistake is running EFA without theory. EFA is exploratory, but it still requires conceptual guidance.
- Another mistake is using PCA when the real purpose is latent construct measurement. PCA may be useful for reducing variables, but it is not the same as factor analysis.
- A third mistake is relying only on the eigenvalue-greater-than-one rule. This rule is simple, but it should be supported by scree plot, parallel analysis, and theoretical interpretation.
- Another mistake is using Varimax rotation automatically. If factors are expected to be correlated, oblique rotation is usually more appropriate.
- Researchers also sometimes delete items only to improve statistics. This can weaken the theoretical meaning of the scale.
- Finally, some researchers report only the final factor table without explaining the decision process. This makes the analysis look mechanical and reduces methodological transparency.
How to Report EFA in a Thesis or Dissertation
A strong EFA report should explain the full process. It should not simply say, “EFA was conducted.”
A good reporting paragraph may look like this:
| “Exploratory Factor Analysis was conducted to examine the underlying dimensionality of the measurement items. Prior to extraction, the suitability of the data was assessed using the Kaiser-Meyer-Olkin measure and Bartlett’s Test of Sphericity. [Result from that tests]. Factors were extracted using [extraction method]. Because the constructs were theoretically expected to be correlated, [rotation method] was applied. The number of factors was determined by examining eigenvalues, scree plot, parallel analysis, and theoretical interpretability. [Number of factor retained, with explanation]. Items with weak loadings, substantial cross-loadings, or poor conceptual fit were reviewed and removed where necessary.[You may add footnote for detain explanation in this part]. The final solution demonstrated a clear and interpretable factor structure as presented in Table 1.” |
Practical Example of EFA Interpretation
Suppose a researcher develops 15 items to measure academic motivation among university students. After conducting EFA, the results suggest three factors.
Items 1 to 5 load strongly on the first factor and relate to learning interest. This factor may be named Intrinsic Academic Motivation.
Items 6 to 10 load strongly on the second factor and relate to grades, employment, and external rewards. This factor may be named Extrinsic Academic Motivation.
Items 11 to 15 load strongly on the third factor and relate to family expectations, social respect, and reputation. This factor may be named Socially Oriented Motivation.
In this example, EFA does not merely reduce the number of items. It reveals the motivational structure behind student responses. A PhD researcher can connect this structure to theory, culture, and institutional context.
This is the real value of EFA: it helps the researcher move from raw questionnaire items to meaningful latent constructs.
| Facing problem in finding good research question? Read this: Find a Good Research Question: 7 Steps Guide |
Conclusion
Exploratory Factor Analysis is a powerful method for examining the dimensionality of measurement items. For thesis and PhD research, it is especially useful in questionnaire development, scale adaptation, scale translation, construct validation, and preparation for CFA or SEM.
The major steps include designing the conceptual model, preparing the data, examining descriptive statistics, selecting software, choosing the extraction method, deciding the number of factors, choosing rotation, deleting problematic items, checking simple structure, finalizing the measurement model, and assessing reliability and validity.
A strong EFA is not judged only by clean factor loadings. It is judged by the quality of reasoning behind the decisions. The researcher must show that the final factor structure is statistically defensible, theoretically meaningful, and suitable for the research objective.
